

Hi All,
I wanted to share a recap of an SQL interview test I recently took. Unfortunately, I didn’t get the role, but I managed to capture the SQL test questions, which I believe are valuable for practice.
For privacy reasons, I won’t mention the employer, and I’ve slightly modified the questions while keeping the main concepts intact.
Why Understanding SQL Logic Matters
Before writing any SQL code, it’s important to fully understand the logic behind the solution. That’s why I’ll break down each question by explaining:
- The thought process behind the solution
- The mathematical formulas (if applicable)
- The optimized SQL query
I’ll go through each question step by step and explain how to approach it in a structured way.
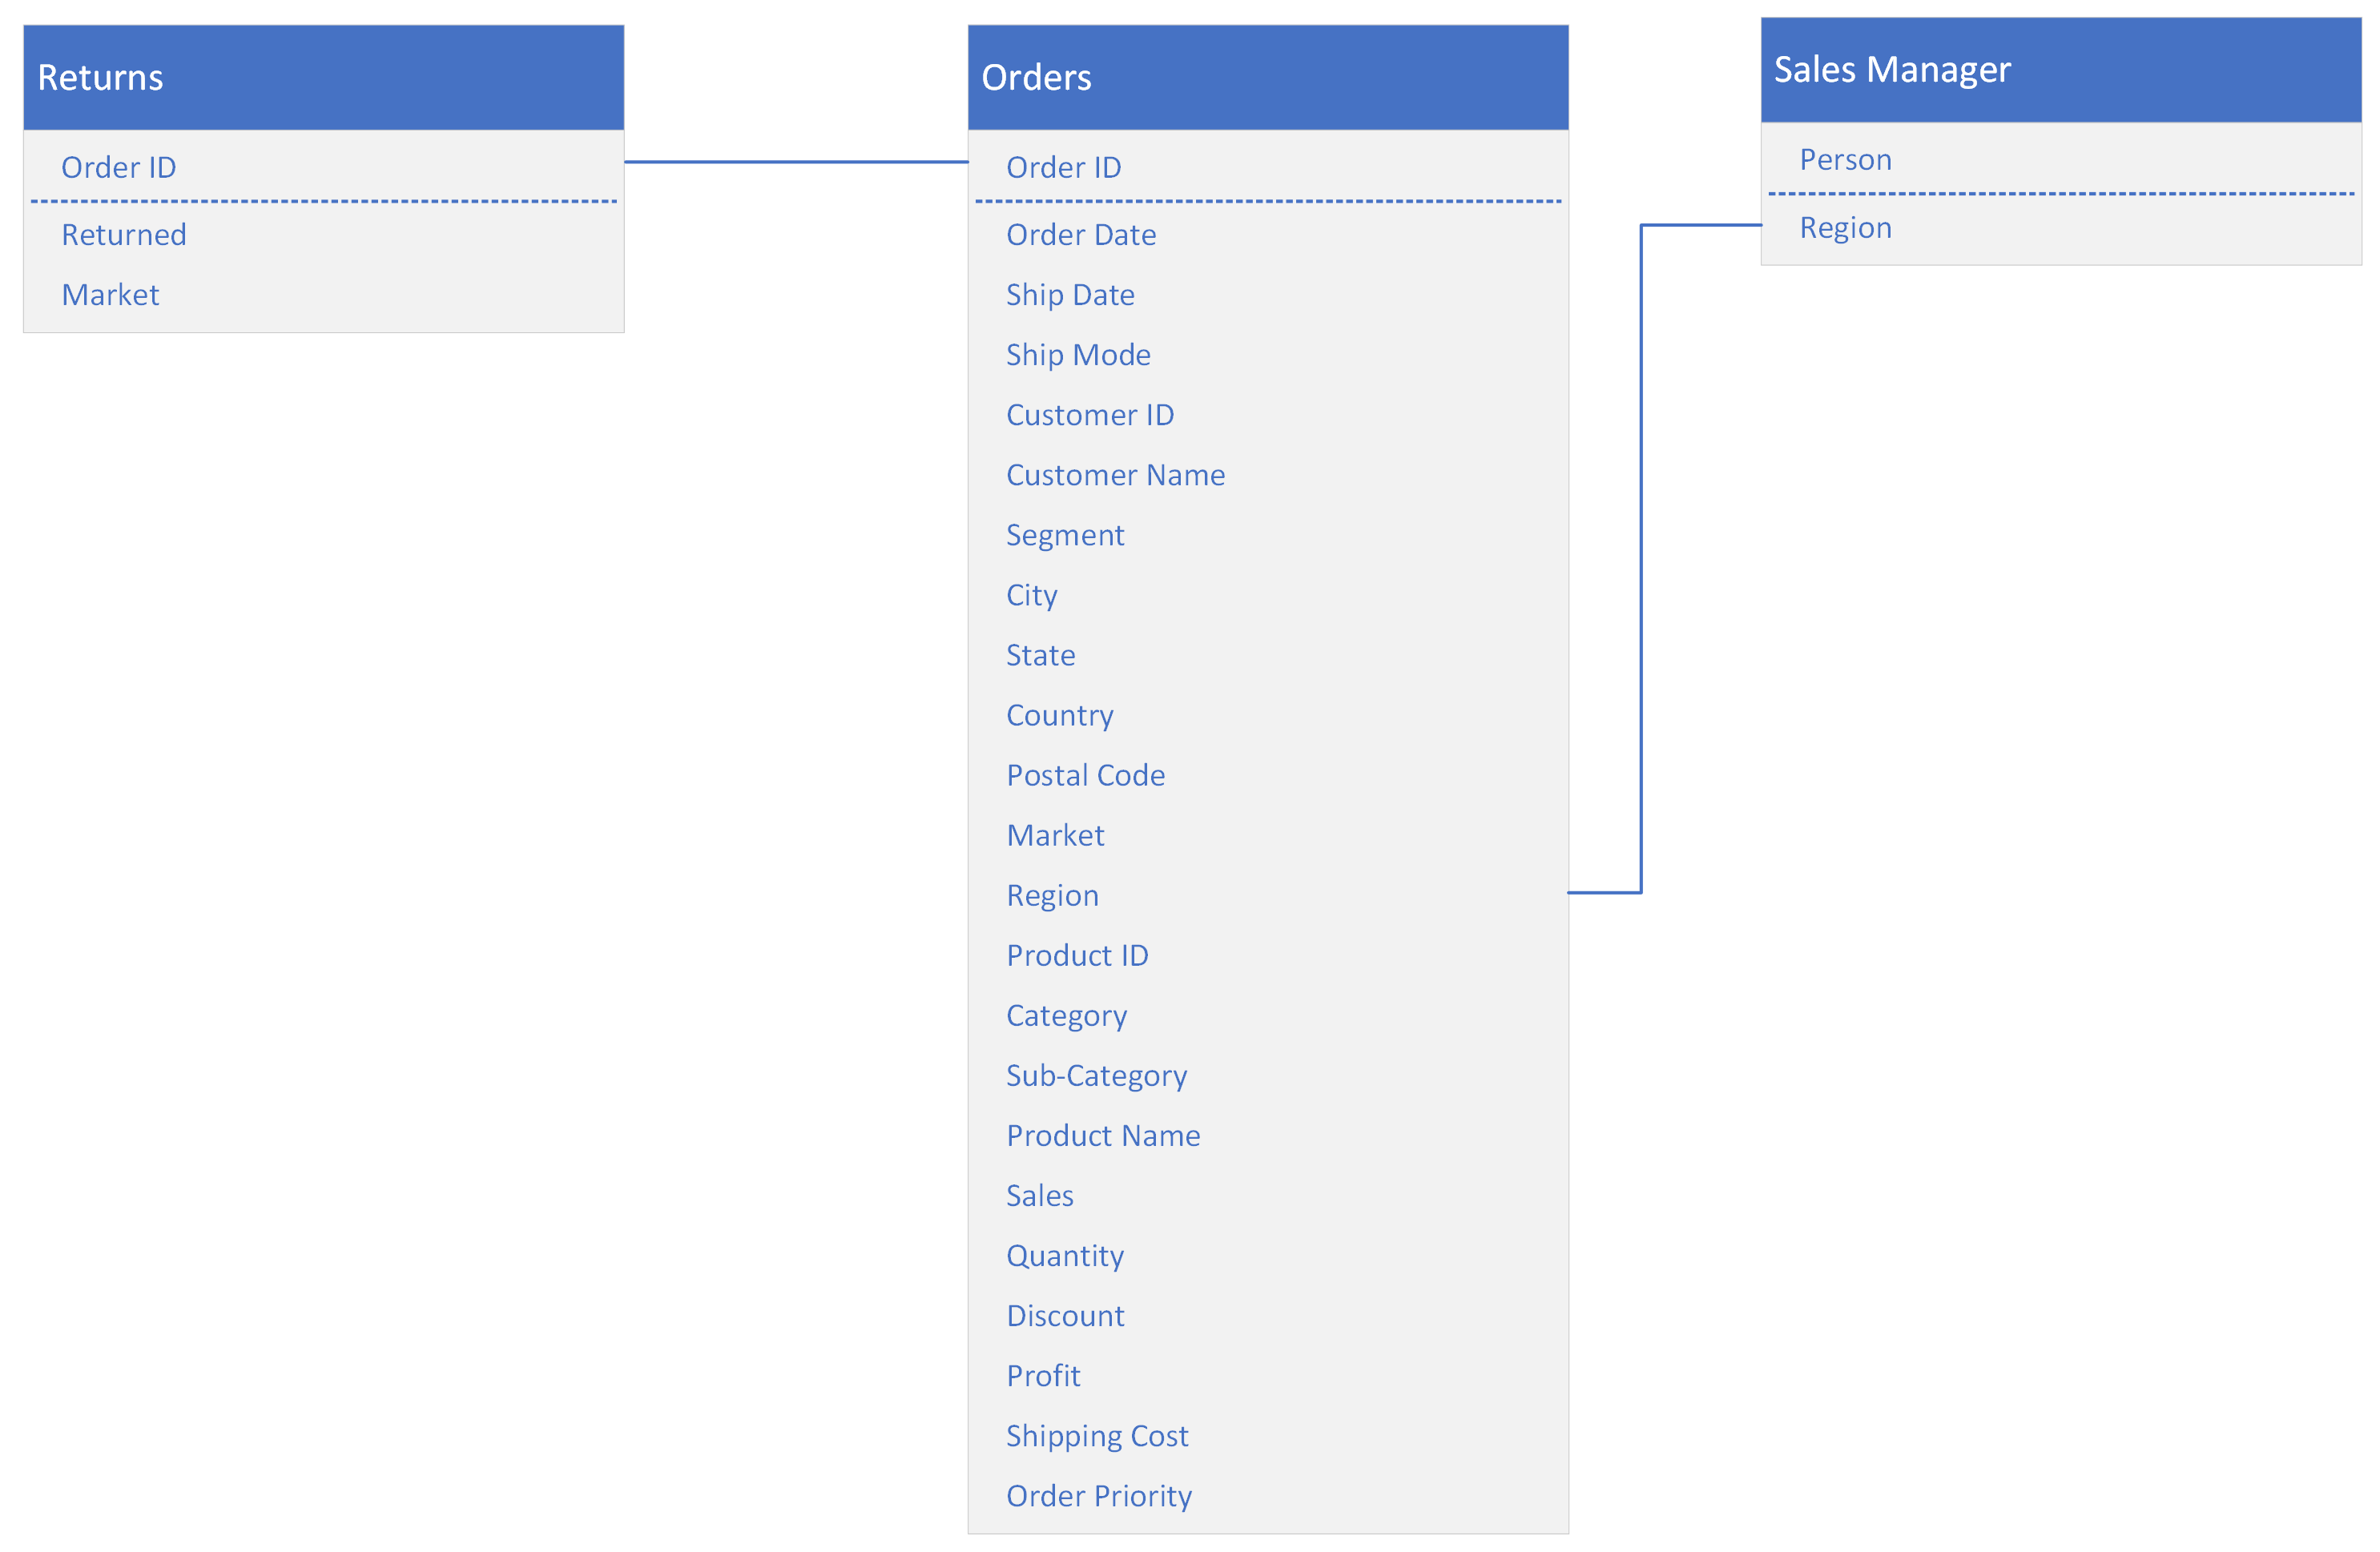
To summarise the above the main table being orders connecting to returns and sales manager through the foreign keys
Please copy and paste this script into your SSMS SQL Server Query to run and follow along if you will
SQL Interview Questions
Q1: Which Sales Manager had the highest sales in 2023?
Q2: What were the Top 5 most returned Products by Category?
Q3: What was the proportion of Profit by State in 2014? time based on order date
Q4: Which Market , Regions have a Profit Margin >4%?
Q5: What was the average days between orders by Sales Manager?
Q1: Which Sales Manager had the highest sales in 2023?
Logic:
- Filter orders for 2023 based on
Order_Date. - Join
OrdersandSales_Managertables onRegion. - Sum the sales for each Sales Manager.
- Sort by total sales in descending order.
- Pick the top Sales Manager.
Mathematical Formula:

Q2: What were the Top 5 most returned Products by Category?
Logic:
- Join
OrdersandReturnstables onOrder_ID. - Filter records where
Returned = 1. - Count how many times each product was returned.
- Group by Category and Product Name.
- Sort by return count in descending order.
- Pick the top 5 most returned products.
Mathematical Formula:

Q3: What was the proportion of Profit by State in 2014?
Logic:
- Filter orders for the year 2014.
- Calculate total profit across all states for 2014.
- For each state, sum the profit.
- Compute the proportion of profit for each state.
- Sort states by highest profit percentage.
Mathematical Formula:

Q4: Which Market & Regions have a Profit Margin > 4%?
Logic:
- Group orders by Market and Region.
- Calculate total profit and total sales per group.
- Compute the Profit Margin using
(Profit / Sales) * 100. - Filter for regions with a profit margin greater than 4%.
- Sort the result by profit margin in descending order.
Mathematical Formula:

Q5: What was the average number of days between orders by Sales Manager?
Logic:
- Find the next order date for each Sales Manager using
LEAD(). - Calculate the date difference between an order and the next order.
- Exclude NULL values (since the last order for each Sales Manager has no next order).
- Compute the average days between orders.
- Sort the result in ascending order for readability.
Mathematical Formula:

Final Summary
| Query | Logic | Mathematical Formula |
|---|---|---|
| Q1: Highest Sales Manager in 2023 | Filter for 2023, sum sales, sort, return top | SUM(Sales) |
| Q2: Top 5 most returned products | Count returns per product & category | COUNT(*) on returned orders |
| Q3: Profit proportion by state (2014) | Calculate total 2014 profit & per-state proportion | (State Profit / Total Profit) * 100 |
| Q4: Markets & Regions with Profit Margin > 4% | Compute Profit / Sales ratio | (SUM(Profit) / SUM(Sales)) * 100 |
| Q5: Avg. days between orders per Sales Manager | Use LEAD(), compute DATEDIFF, take average | DATEDIFF(DAY, Order_Date, Next Order_Date) |
Leave a Reply